
Bitcoin’s price recently tried to rise again after falling, but the upward drive is currently stalled due to uncertain market conditions. Traders are waiting for news, economic data, or signals before making big moves. After a big drop in price, Bitcoin is now moving sideways between a certain high and low level instead of trending up or down, therefore, frustrating the short-term traders.
Bitcoin Profitable Supply Hit to 2022 Level
Despite current market conditions, past data indicate the potential for a bottom forming in the market. Generally, past cycles have shown that similar conditions occurred prior to new recovery phases.
Bitcoin has recently fallen below a previous level that triggered the same price action in the bear market of 2022. About 50% of BTC are currently valued at a loss, meaning that 50 % of currently circulating BTC are currently underwater. Historically, this percentage usually coincides with major price bottoms in the cryptocurrency market, and not with extended periods of time after major selloffs.
In past cycles, when the amount of profitable BTC starts to decrease to around 50% of the overall supply, the incentives to sell reduce. Thus, individuals holding BTC are much less likely to sell and do not feel an urgency to realize losses; therefore, the amount of sell-off pressure decreases. This has allowed for previous cycles to hold through volatility. As a result, the price will not stabilize until after the market has recovered.
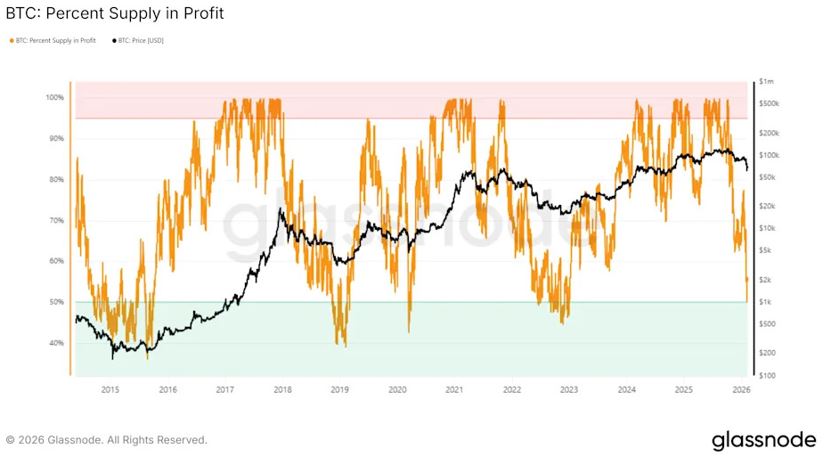
Lower prices also attract fresh capital. The value-oriented buyers enter when downside risks exceed upside possibilities. This new demand has historically enabled BTC to revive, once profitable supply either falls to r below the 50% mark.
Why Bitcoin is Likely to Bounce Back?
The macroeconomic indicators are confirming that the process of bottoming out is taking place. The Pi-Cycle Top Indicator compares the 111-day and doubled 350-day moving averages in order to assess whether Bitcoin (BTC) is reaching an overheated state or not. In general, the Pi-Cycle Top Indicator suggests that when shorter-term moving averages extend beyond the upper limit of an established range (the upper limits are based on the 350-day MA), then a major market top is likely in place. However, this instance is extremely different from historical events in terms of the way that the 111-day MA is trading lower than the double 350-day MA. This tells us that BTC is not in an environment characterized by speculative activity.
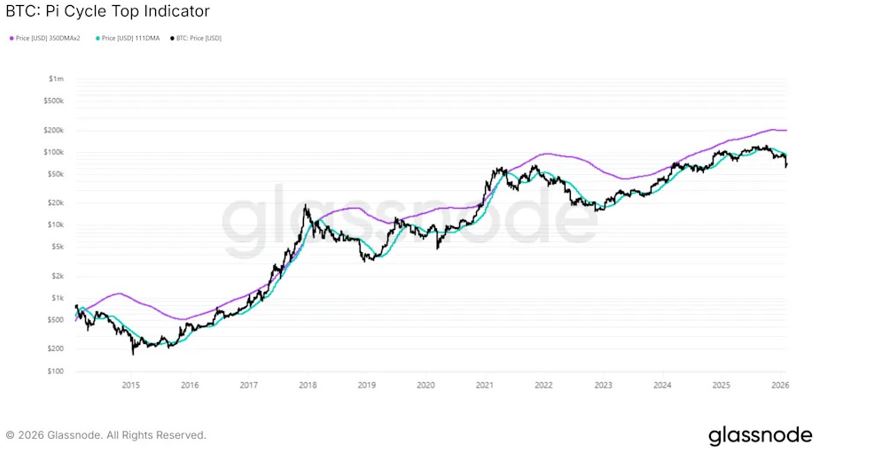
BTC has moved higher and created a macro-bullish trend from March 2023 without an extraordinary amount of over-exuberant activity. The lack of excessive speculative activity has given a gradual increase in price since this period, to the point where it provides the first clear bottom call in almost 3 years.
Read:
Key Bitcoin Price Levels
The 23.6% Fibonacci retracement level is located at approximately $63,007, and this level acts as a support line, preventing BTC from moving lower at this time. BTC is currently being traded at approximately $68,905, or testing this price level to see if it continues to hold. BTC has not been able to break above $71,672 and therefore cannot be considered to have been able to break out above its current trading levels. If BTC is able to continue to receive additional inflows, it may be able to rally to the resistance level of $71,672 and potentially to the target level of $78,676. BTC will have confirmed its recovery when it reclaims $85,680 as a sustainable support level.
However, the risks towards downside persist due to the changing market structure. The short-term to long-term holder supply ratio has moved above the upper band, indicating short-term participation associated with higher volatility.
This would hurt Bitcoin’s price chances of crossing the $71,672 barrier, continuing its consolidation. Even if BTC does push past said resistance, the selling will pull it back down towards $63,000, invalidating the bullish thesis